Archived article
Please note that tax, investment, pension and ISA rules can change and the information and any views contained in this article may now be inaccurate.
The FTSE 100 is making heavy weather of making fresh gains and reaching new all-time highs and one possible explanation for its pedestrian progress is that earnings forecasts have stopped going up.
“The spring’s March to a fresh record peak above 7,500 coincided with strong increases to analysts’ consensus earnings expectations, themselves the result of the slide in the pound following the June 2016 EU referendum vote," says AJ Bell Investment Director Russ Mould.
“While the pound inched lower over the summer, analysts have stopped nudging their forecasts higher – and actually started cutting them, at least for 2017.
“After increases to aggregate FTSE 100 pre-tax income forecasts for 2017 in Q2, Q3 and Q4 of last year and Q1 of this, estimates flattened out in Q2 and then slid by 3% in Q3.
“Estimates for combined profits in 2018 have been flat at around £213 billion for the last two quarters.
FTSE 100 pre-tax profit forecasts (£bn):
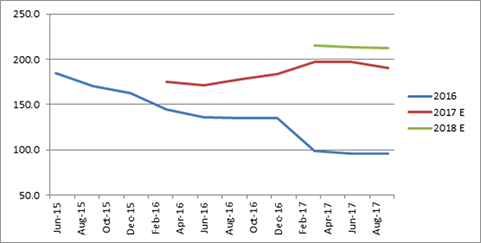
Source: Company accounts, Digital Look, analysts’ consensus estimates
“Profit warnings from WPP and Provident Financial will not have helped but they represent less than 1.5% of the FTSE 100’s aggregate earnings and there appear to be three bigger factors at work:
- Oil is struggling to break-out beyond $55 a barrel
- Mining analysts don’t seem to trust the summer strength in copper, aluminium, iron ore and zinc, as they are forecasting fresh declines in miners’ earnings for 2018
- Profit estimates for the banks are stalling again and look stuck at around £30 billion for 2017 and £36 billion in 2018 (a figure which finally takes them back to the peak levels of 2007).
“These are far more important that the woes of WPP or Provident Financial. For 2017, financials, oils and miners are forecast to generate 49% of aggregate FTSE 100 pre-tax profits and 71% of aggregate estimated profit growth.
| Percentage of forecast FTSE 100 profits | Percentage forecast FTSE 100 profits growth | |||
| Financials | 24% | Financials | 26% | |
| Consumer Staples | 15% | Mining | 25% | |
| Mining | 14% | Oil & Gas | 20% | |
| Oil & Gas | 11% | Health Care | 12% | |
| Consumer Discretionary | 10% | Consumer Staples | 8% | |
| Health Care | 9% | Industrial goods & services | 4% | |
| Industrial goods & services | 9% | Consumer Discretionary | 3% | |
| Telecoms | 3% | Telecoms | 1% | |
| Utilities | 3% | Technology | 0% | |
| Real estate | 1% | Real estate | 0% | |
| Technology | 0% | Utilities | -1% | |
Source: Company accounts, Digital Look, consensus analysts’ estimates
“These three areas will need to offer fresh profit forecast upgrades if the FTSE 100 is to regain its upward momentum and it does appear that oils, miners and the banks hold the key to the index’s fate for the rest of this year and beyond.
“This is something which buyers of tracker funds and ETFs in particular need to bear in mind, as they must make sure they are comfortable with the risk-reward profile offered by these three sectors in particular, if they are seeking broad-brush exposure to UK equities.
“The lack of momentum in earnings estimates clearly reflects doubt over whether the Trump bump can be sustained, as the US President struggles to push through tax reforms, infrastructure spending and deregulation plans, and may well serve to confirm suspicions that excess debt and weak demographics mean the West is stuck in a low-growth, low-inflation rut – itself a factor in why central banks are hardly rushing to tighten monetary policy eight years of the end of the Global Financial Crisis.
“Sterling’s rally last week, amid what was perceived to be hawkish rhetoric from the Bank of England, could put even further pressure on FTSE 100 earnings, especially if the Monetary Policy Committee actually follows through on its tough talk and finally raises interest rates – although using the trade-weighted basket of currencies provided by the Bank of England, the pound ended Friday at 77.45, still some 12% below where it was on the day of the June 2016 EU referendum and only back at a level last seen on 17 July, so it may not pay to overdo the lurid headlines just yet.”
These articles are for information purposes only and are not a personal recommendation or advice.
Related content
- Thu, 18/04/2024 - 12:13
- Thu, 11/04/2024 - 15:01
- Wed, 03/04/2024 - 10:06
- Tue, 26/03/2024 - 16:05
- Wed, 20/03/2024 - 16:30