Archived article
Please note that tax, investment, pension and ISA rules can change and the information and any views contained in this article may now be inaccurate.

One of the most important lessons of investing is to buy as cheaply as you can (with the ultimate aim of selling as expensively as you can, or even not selling at all, if you really pick a winner).
While they may sound like the blindingly obvious, investors can occasionally be seduced, especially when markets are rising, to forget this discipline.
They can be tempted to follow momentum and buy in the view that they will be able to sell the security on to someone else when it suits them.
Such strategies can work very well for a time. Until they don’t. And then losses can be heavy, as the valuation paid provides little or no margin of safety should something go wrong, either on a broad market basis or the company specific level.
None of us would walk into a restaurant or clothes shop and pay any price to eat or buy something. The same judgement should apply to stocks, bonds or for that matter the indices which Exchange-Traded Funds (ETFs) can track for you.
As Warren Buffett put it so pithily: “Price is what you pay. Value is what you get.”
Anyone who questions the importance of valuation should consider the research by James P. O’Shaughnessy in his book “What Works on Wall Street.” The numbers may have dated a little but the 50-year timespan feels appropriate, particularly for investors who are saving for their retirement with a SIPP.
Compound average annual rates of return from US stocks by valuation type, 1951-2003
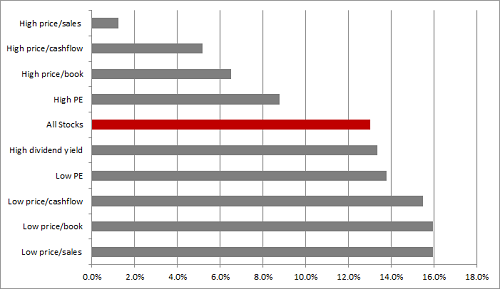
Source: James. P. O’ Shaughnessy “What Works on Wall Street”
The wise owls at US-based global investment firm GMO generated similar results when they looked at America’s S&P 500 index, using data from 1940-2012 and Professor Robert Shiller’s cyclically adjusted price earnings (CAPE) ratio.
Whether the mechanics of CAPE interest you or not, the results seem to suggest that the best returns come from buying low – not buying high.
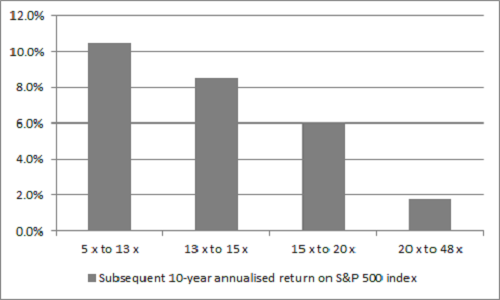
Source: GMO. Covers S&P 500 from 1940 to 2012, based on Shiller CAPE PE data, which can be found at http://www.econ.yale.edu/~shiller/data.htm
First test
This begs the question of how best to spot and measure “value.”
The first step when it comes to spotting potential targets is to think like an industrialist. A share is just that, fractional ownership of a business and the value investor must therefore approach a stock as if s/he were looking to buy the whole firm and not just a stake.
Seth Klarman, founder of Boston-based multi-billion-dollar hedge fund Baupost, once noted: “Investment success …. requires remembering securities are not blips on a Bloomberg terminal but are fractional interests in – or claims on – companies. Business fundamentals, not price quotations, convey useful information.”
There are many ways in which you can assess whether a stock is cheap or expensive, either relative to its own history or to the market or in absolute terms (and it is the last-named which really counts) but this column’s 26-year experience in the markets would say five really matter.
All five are explained below.
1. Price/Earnings Ratio (PE)
This is calculated as the share price divided by forecast earnings per share and expressed as a ratio, or multiple. A short cut is to divide the market cap by estimated future net earnings and this explains what a PE really represents – the number of years in which it will take a firm to earn, and thus justify, its market valuation. This ratio therefore really means something and it is worth asking yourself just how confident you are a firm will be trading well, or even in existence, 10, 20 or 30 years down the road.
In theory, the lower the PE the cheaper the stock, but care is still needed. A PE or PEG ratio, which divides the PE by forecast earnings growth, could be low because earnings progress is about to slow or hit a cyclical peak. The stock could therefore be a bad investment as falling EPS figures tend to mean a falling share price.
A PE can also be negative, though this simply means the firm is in loss. Then the investor needs to find out why and there are three possible reasons behind a negative PE:
- The firm could be a start-up companies in an areas such as technology, biotech or mining, where sales are small and initial investment heavy
- Cyclical stocks such as steelmakers or airlines often fall into loss as the economy goes into recession.
- The stated loss can be a ‘paper’ deficit rather than a cash one because a firm may have taken a big one-off restructuring charge or write-downs against the value of assets on its balance sheet. In this case the investor should look beyond the so-called 'exceptional' items and look at the underlying profit.
Even stocks with negative PEs can be worth buying – they can be some of the best turnaround candidates – but you will need to then look at other valuation tools to provide a better context for decision making.
2. Sum-of-the-parts
A different way to look at whether a stock is cheap is to value its individual business units separately, based on the valuations afforded by the market to comparable quoted companies. The values accorded to each segment are then aggregated, and then adjusted for cash, whose worth is added, or debt, which is subtracted.
The result is then compared to the firm’s market capitalisation to see if there is a discrepancy. This is called a ‘sum-of-the-parts’ calculation and it is particularly useful for firms which are quasi-conglomerates, such as FTSE 100 compressors to medical devices to sensors expert Smiths.
Smiths Group is regularly held up as a stock which may be cheap on a sum-of-the-parts basis
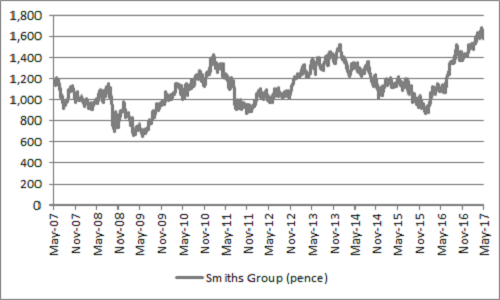
Source: Thomson Reuters Datastream
3. Price to Net asset Value, also known as price to book value
NAV or BV is assessed by dividing shareholders equity on the balance sheet by the number of shares in issue.
The share price is then in turn divided by this figure to get the P/NAV or P/BV ratio. Shareholders equity is total assets minus total liabilities and literally the net worth of the firm's assets today.
Any figure below one therefore suggests a firm is potentially looking cheap.
P/NAV is a popular tool for measuring the worth of certain sectors, notably real estate firms, insurance companies, banks and house builders since it gives a clear view of the actual value of their key assets.
Real Estate Investment Trusts (REITs) is one sector where price/NAV can be a useful valuation metric
| Share Price/NAV | Dividend yield, 2017E | |||
| Safestore | 49.0% | Newriver | 6.2% | |
| Big Yellow | 33.9% | INTU | 5.2% | |
| TRITAX Big Box | 22.9% | British Land | 4.7% | |
| Londonmetric | 18.5% | Londonmetric | 4.6% | |
| Newriver | 18.4% | TRITAX Big Box | 4.4% | |
| Shaftesbury | 7.7% | Hammerson | 4.4% | |
| SEGRO | 2.6% | Town Centre | 3.9% | |
| Hansteen | -0.5% | Big Yellow | 3.8% | |
| Cap & Counties | -5.9% | Land Securities | 3.5% | |
| Workspace | -6.2% | Hansteen | 3.5% | |
| CLS | -8.2% | SEGRO | 3.3% | |
| Hammerson | -15.2% | Safestore | 2.9% | |
| Town Centre | -17.6% | CLS | 2.9% | |
| Great Portland | -17.8% | Workspace | 2.8% | |
| Derwent London | -21.2% | Derwent London | 2.0% | |
| INTU | -23.3% | Shaftesbury | 1.6% | |
| Land Securities | -24.0% | Great Portland | 1.5% | |
| British Land | -30.2% | Cap & Counties | 0.5% |
Source: Based on historic dividend per share figures from the companies’ accounts and consensus analysts’ forecasts for dividend per share from Digital Look
4. Enterprise Value multiples
A company's Enterprise Value (EV) is determined by adding its forecast debt and subtracting its forecast cash position from its market capitalisation.
This adjusts for the state of a company’s balance sheet and helps to factor in the potential risk posed by a substantial debt pile and the relative safety of a net cash position.
The EV figure tells the investor exactly what it would cost to acquire the firm, providing a useful benchmark valuation which can be measured against acquisitions made in the same sector or country.
EV multiples are often used by predators such as trade buyers and private equity firms when they assess how much to pay for a firm.
The EV then can be divided by sales (EV/Sales), earnings before interest taxes depreciation and amortisation (EV/EBITDA) and operating free cash flow (EV/OpFcF) to give a range of valuation multiples which can be used to compare stocks with each other.
In the case of a loss-making company, EV/Sales can be helpful and, depending on its average operating margin over a cycle and balance sheet strength, a rating below 100% could be interesting.
5. Discounted Cash Flow (DCF)
A Discounted Cash Flow (DCF) calculation is in theory the most scientific way of valuing a firm, although this notion has many detractors. The idea of a DCF is to establish how much a firm's future cash flow is worth in today's money. This is referred to as the company’s ‘intrinsic value’.
The four key elements of a DCF are:
- A basic operating free cash flow (OpFcF) calculation:
operating profit + depreciation and amortisation + change in net working capital - capex
- Establishing forecasts for OpFcF over the next ten years or longer
- Determining an appropriate weighted average cost of capital (WACC)
- Discounting future OpFcF using the WACC to establish fair or intrinsic value for the equity
'Deep value' investors swear by them, because of the long-time horizons involved. The discipline required to build a DCF also means an investor asks so many vital questions about risk – and not only risk to the firm's business model but general market risk too.
DCFs are often used for start-up companies that generate neither profit nor cash flow when they join the stock market - and in some cases they generate no revenues either. The assumptions that underpin the DCF must therefore be stress-tested more carefully, as evidenced by the experiences of investors in loss-making satellite communications provider Avanti Communications, as per the chart below.
Contrast this with the chart for Unilever over the same time period – a firm which Warren Buffett recently tried to take over, via his stake in American company Kraft Heinz. A DCF will underpin any private equity approach for a firm, as they will want to assess the cash flow potential – and in Unilever’s case, sales and margins are lot more predictable.
This is not to say Unilever should be bought now and Avanti sold – but it does show how DCFs can make investors think about the accuracy and reliability of forecasts and the strengths and weaknesses inherent in company business models.
DCF analysis ensures investors think about risks as well as reward

Source: Thomson Reuters Datastream
Russ Mould, AJ Bell Investment Director

Written by:
Russ Mould
Russ Mould has 28 years' experience of the capital markets. He started at Scottish Equitable in 1991 as a fund manager and in 1993 he joined SG Warburg, now part of UBS investment bank, where he worked as equity analyst covering the technology sector for 12 years. Russ joined Shares in November 2005 as technology correspondent and became Editor of the magazine in July 2008. Following the acquisition of Shares' parent company, MSM Media by AJ Bell Group, he was appointed AJ Bell’s Investment Director in summer 2013.
Related content
- Wed, 17/04/2024 - 09:52
- Tue, 30/01/2024 - 15:38
- Thu, 11/01/2024 - 14:26
- Thu, 04/01/2024 - 15:13
- Fri, 17/11/2023 - 08:59