Archived article
Please note that tax, investment, pension and ISA rules can change and the information and any views contained in this article may now be inaccurate.

As the FTSE 100 stands near record highs following a stunning run of 14 consecutive gains which spanned the festive and New Year period all investors will be asking themselves is whether the UK’s leading index is becoming overcooked. In fact, with stock market indices from Korea to Kuwait, Singapore to Switzerland and Egypt to Europe’s Stoxx 50 all at 12-month highs, the same question could be applied more widely.
After all, the last time the UK put in such a powerful performance, with 11 straight daily gains, was May 1997. In July of that year – just two months later – Thailand devalued its currency, the baht, triggering an economic crisis across South East Asia that rocked markets worldwide. This ultimately sowed the seeds of the Russian debt default in 1998 which roiled stocks to such an extent that the US Federal Reserve ended up co-ordinating the $3.6 billion bailout of the Long Term Capital Management hedge fund.
The index ended 1998 above the levels reached in May 1997 - but it was a bumpy ride all the same, with two major corrections thrown in for good measure.
Previous FTSE 100 winning streak was followed by a rise in volatility in autumn 1997

Source: Thomson Reuters Datastream
It may therefore be worth carrying out a few basic checks to test the markets’ broader health to ensure they are merely bouncy and not worryingly bubbly.
Five signals to test
This involves visiting five useful key datapoints and reprising an exercise we last carried out in in the middle of August 2016. Since then the FTSE 100 has advanced by some 5% from the 6,866 mark.
1. The transportation indices
The old theory goes that if the transports are not performing, the industrials can’t either, as if nothing is being shipped, nothing is being sold. It is therefore of a little concern that the FTSE All-Share Transportation index stands 2.5% below its August 2016 peak, although a 20% swoon over the same period in Royal Mail, the benchmark’s largest constituent, hardly helps here.
FTSE All-Share Industrial Transportation sector is losing a little steam ....

Source: Thomson Reuters Datastream
Even if it is possible to make allowances for the becalming influence of the UK’s postal service, it is harder to sweep under the carpet a 3% drop from December’s all-time high in the Dow Jones Transportation index in the USA, although this is admittedly a minor move in the wake of a powerful run higher.
...as is its American equivalent, the Dow Jones Transportation index

Source: Thomson Reuters Datastream
Neither index is flashing red by any means, as both trade close to all-time peaks, but their inability to provide leadership must be followed closely in the coming weeks. This could be seen as an ‘amber’ signal, even if some encouragement can be drawn from recent American data in particular.
The US Cass Truckload Linehaul index (which measures per-mile truckload linehaul rates) showed a 0.9% drop in December - the tenth straight year-on-year decline. Although analysts did flag some tentative firming in spot prices. The Cass Intermodal price index showed even more signs of life as the total inter-modal per-mile costs rose 1.5%
Best of all, the Cass Freight Index showed 3.5% year-on-year growth in shipments in December, the second increase in the space of three months after a dismal 18-month spell of declines. Parcels and airfreight led the way, followed by truck tonnage, while rail and barge volumes showed a lesser rate of decline.
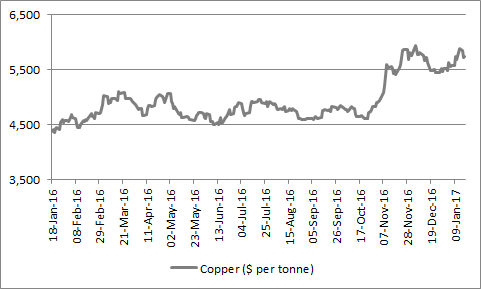
2. Doctor Copper
The industrial metal is a great barometer for global economic health. So it is of some concern that 2016 was the fifth year in a row that the average price for the year ($4,871) came in below that of the prior 12-month period, according to data from www.mining.com.
However, recent price action has been more like it, at least from the bulls’ point of view. An early year surge leaves copper near 18-month highs. Buoyed by hopes for President Trump’s infrastructure spending plans and data that show China, the source of 45% of global demand, has begun to suck in greater volumes of the metal. December 2016 refined copper imports rose 30% month-on-month, enough to take total imports for last year to 3% above 2015 level and to a new record high of 4.95 million tonnes, according to www.mining.com.
Granted, other factors may be at work. Miners at the giant Chilean Escondida site are threatening to strike over pay, while Indonesian export policy could also reduce supply if a proposed ban on exports of unprocessed concentrates is enforced.
Nevertheless, a sustained increase in copper prices could help to reaffirm investors’ faith that the inflation/reflation trade which has dominated since the UK Brexit and US Presidential votes remains the right narrative to follow.
Dr. Copper has made healthy gains in early 2017
Source: Thomson Reuters Datastream
3. Small caps
Market minnows are an excellent indicator of risk appetite - they tend to outperform when investors are bullish and fall faster than the broader market when they are bearish.
The UK’s FTSE Small Cap and America’s Russell 2000 have both advanced strongly, even if the megacap FTSE 100 and Dow Jones Industrials are grabbing all of the headlines. The Russell has paused since mid-December so investors will need to keep an eye on this and overall bulls will want to see these benchmarks keep ticking higher and their gains so far offer a positive sign.
Small caps have made big gains to suggest market appetite for risk remains healthy

Source: Thomson Reuters Datastream
4. Market volatility
Volatility can be the friend of investors since it can provide chances to sell stock expensively or buy it cheaply. History shows that stock indices progress best when they make serene progress and a series of modest gains. By contrast, markets tend to fare less well when trading is choppy and there are big swings up and down.
After a series of violent swings in January and February last year, when fears of China’s economy predominated, and five straight days of open-to-close movements of more than 2% in the aftermath of the referendum vote, the FTSE 100 has generally moved higher with a minimum of fuss. There have only been five open-to-close movements of more than 1% in the index since President Trump’s election and none of more than 2%
Further peaceful gains, in incremental steps, would further encourage this is a bull run and not some frenzied bubble that is primed to burst, assuming historic trends repeat themselves.
A period of market calm is looking like a good thing, at least for the moment:

Source: Thomson Reuters Datastream
That said, investors must remain mindful of Minsky’s comment that stability ultimately begets instability as periods of undue calm only serve to encourage further risk taking. Since 1997, the UK has seen an average of 96 open-to-close moves in the FTSE 100 of more than 1% yet the last time a given year reached that level was 2011. Similar periods of calm between 1995 and 1997 and 2004 to 2007 then saw volatily explode and markets progress while gyrating and only to finally fall and fall hard.
Volatility in the FTSE 100 has been eerily low for the last five years
| 2012 | 2013 | 2014 | 2015 | 2016 | 20-year average | 10-year average | 5-year average | ||
| Number of moves > 1% | 63 | 47 | 35 | 31 | 53 | 76 | 75 | 46 | |
| Number of moves 2-5% | 10 | 7 | 5 | 22 | 20 | 19 | 18 | 13 | |
| Number of moves > 5% | 0 | 0 | 0 | 0 | 0 | 1 | 2 | 0 | |
| TOTAL | 73 | 54 | 40 | 53 | 73 | 96 | 94 | 59 |
Source: Thomson Reuters Datastream
5. Valuation – and especially the dividend yield
In the end, the valuation paid for an asset is the ultimate arbiter of the investment returns made on it. Valuation metrics using forecast earnings can be unreliable, as those forecasts are often wrong, so dividend yield can offer more comfort. Management teams are reluctant to cut the shareholder payouts as this tends to hit a share price hard and potentially their own wallets.
At the time of writing, the FTSE All-Share is yielding 3.44%, compared to a 10-year Gilt yield of 1.33% - that’s a 201 basis point (2.01%) premium.
That may be less than the 288 basis point premium on offer in late August (owing to the rise in equities and sudden sell-off in bonds that has taken the 10-year Gilt yield up from 0.64% on 31 August) but the All-Share has only twice offered a premium yield of 2% or more since 2008 - and on both occasions the stock market promptly made healthy gains.
The danger here is that inflation expectations go higher and either drag bond yields with them, prompt a Bank of England interest rate increase, or both, potentially eroding the premium yield on offer from stocks. Equally, there is a risk dividends could be cut, especially as the FTSE 100’s dividend cover is thin by historic standards.
The divided cut promised by publisher Pearson (and subsequent 30% share price collapse) does warn of the dangers here but the yield premium looks supportive to stocks, even if the mood of the market is more about capital return than reliable income right now.
UK stocks still appear to offer a substantial premium yield relative to Government bonds:

Source: Thomson Reuters Datastream
In sum none of these five signals look to be flashing danger, although the transportation stocks are borderline amber and the Russell 2000’s pause for breath needs to be monitored. But perky UK small caps, strong copper prices low market volatility and equity yield premium over bonds could all be interpreted as clear green lights to fresh advances in the FTSE 100. If anything the greatest danger could be complacency, as volatility looks very low relative to the UK’s history over the last 10 or 20 years.
Pounding the table
For the moment, the simple narrative of pound down/dollar up and index up is providing a trend that remains the investor’s friend. It may be that any sudden – and seemingly unexpected – rally in sterling may provide the first challenge to the FTSE 100’s seemingly inexorable rise.
Pound/dollar cross rate remains a big driver of short-term sentiment

Source: Thomson Reuters Datastream
Yet a year ago markets were fixated with the oil price and six months before that with China’s currency and stock indices. It is rather depressing that the market seems incapable of focusing on more than one narrative at once and perhaps this is the influence of algorithm-based, trend-following funds at work.
Whatever the reason, the pound is currently the dominant story. But few if any investors will feel they have an edge here and nor is it likely to be worth their while trying to develop one, as this short term trend could easily dissipate – China, Europe, oil or something else could easily suddenly dominate the headlines.
However, history suggests it will be an ‘unknown unknown’ rather than a ‘known unknown’, to borrow from former US Secretary of Defense Donald Rumsfeld, that will ultimately puncture the bull run. After all, 1995-97’s serene gains were interrupted by a Thai debt default while 2004-07’s party came to end when the American housing market rolled over and exposed the world to the dangers posed by sub-prime mortgage lending. Few saw either coming.
Russ Mould, AJ Bell Investment Director

Written by:
Russ Mould
Russ Mould has 28 years' experience of the capital markets. He started at Scottish Equitable in 1991 as a fund manager and in 1993 he joined SG Warburg, now part of UBS investment bank, where he worked as equity analyst covering the technology sector for 12 years. Russ joined Shares in November 2005 as technology correspondent and became Editor of the magazine in July 2008. Following the acquisition of Shares' parent company, MSM Media by AJ Bell Group, he was appointed AJ Bell’s Investment Director in summer 2013.
Related content
- Wed, 17/04/2024 - 09:52
- Tue, 30/01/2024 - 15:38
- Thu, 11/01/2024 - 14:26
- Thu, 04/01/2024 - 15:13
- Fri, 17/11/2023 - 08:59